Today we’re going to talk about markets in general, how to recognize them and then in the following articles, we’ll be looking at each type of market in more detail. Why is it important to discern what type of market you’re dealing with as a trader (or investor)?
The short answer is, because different market conditions demand different approaches and different strategies. But perhaps most importantly, knowing what kind of market you’re dealing with at the moment, might just be the best way to force yourself to stay on the right side of the market, instead of either going against the trend or expecting irrational results from the market at any given time. We’ll be looking at the market in three general conditions or trends:
A bull market
A bear market
A ranging market
First of all, we must address the elephant in the room. It’s not always easy to determine conclusively what type of market you’re in at the moment. No bull market goes up-only and no bear market down-only. This is especially difficult at the turning point, therefore trying to hit the exact bottom or top tends to be a problematic affair, usually reserved for Twitter larpers bragging about their heroic charting skills - in past tense.
There is a saying in these parts, “the first and the last 1/8th of the trend is the most expensive one.”
What this means is that it’s very difficult to know when the trend has truly reversed and if we jump the gun we end up losing a lot of money counter trading at the most inopportune moments, before being finally right. For an easier illustration think of some bear minded trader who continues to short a raging bull market every time it looks “toppy” or a knife catching bull who buys every panic drop in a bear market, hoping it to be “the bottom” and make a fortune on the way up. I’m sure you can imagine that this sort of mentality doesn’t usually end all that well.
The truth remains that the only way to determine that a trend has reversed with 100% certainty is well after the fact. Therefore no matter how high your conviction, you must always allow for the option of being wrong on the matter and protect your capital accordingly.
This is also the reason that “the trend is your friends, until it’s not anymore” is a good motto to encompass in your trading strategy. This simply means that you should always assume trend (or market type) continuation until the market proves to you that it has indeed changed. But you will only know this latter down the line, not in the heat of the moment, when you’re heroically trying to predict a big trend change. Hence the expensive first and last 1/8th of any market or trend saying.
It’s much better to wait for a more convincing and lasting reversal of a trend, before going long in the above example. Don’t try to be a hero or a mindless bull, when the market is in a giant downtrend. And if you do go all bravado, just make sure to risk less and cut your positions when invalidated, don’t go down with the ship!
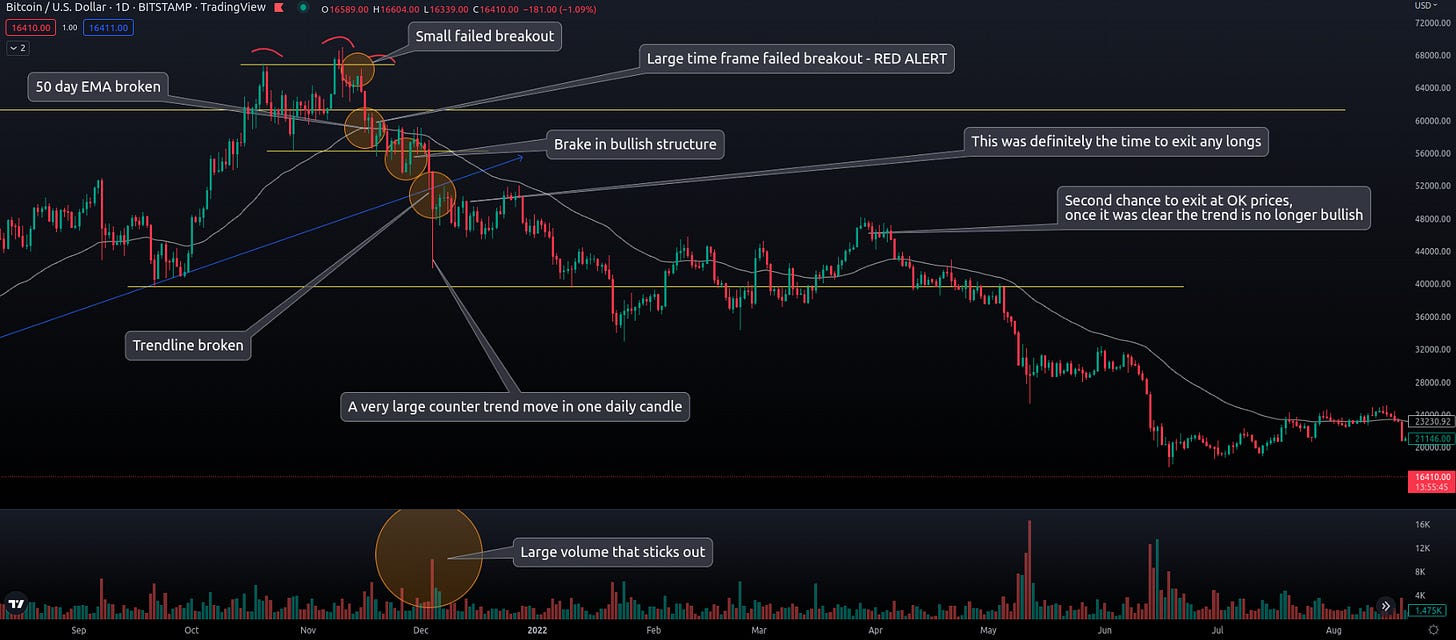
In the bottom image we see a very messy picture (sorry) where signs of trouble and an indication of a change in the larger trend started to accumulate. The more warning signs we spot, the better the odds of an actual change in trend. In this example, the actual break in trend only happened at the last break of support (the last yellow bubble). But the signs were there before.
We had a similar picture at the next bull market top, before this larger bear market, where we find ourselves at this moment. There were multiple warning signs that something was off. And to an observer with an open mind, they screamed get the hell out! Even if you waited for the actual breakdown on that big candle and had the wisdom to exit there, you did just fine. The top was at 67,000 USD, therefore even exiting at 45,000 - 52,000 USD is good enough, especially considering that we just licked 15,000 USD per one Bitcoin. Skip the first and the last 1/8 of the move and you can still make good money, with much smaller chances of being wrong. No certainties, just probabilities.
Within each market there are counter trends being played constantly.
For that reason you must always first determine what is your time frame. Are you looking at long term trends, months, years, decades or perhaps you like to complete your trades within hours, days or weeks?
You really need to think about this and then judge the market through this particular lens. There is no practical use for you to determine that the multi month or year trend is up, when you’re looking at hourly price changes and are playing within much smaller time frames. Equally, there is no point concerning yourself with intraday price movements, when you’re focused on trading or investing with the prospect of holding positions for years at a time.
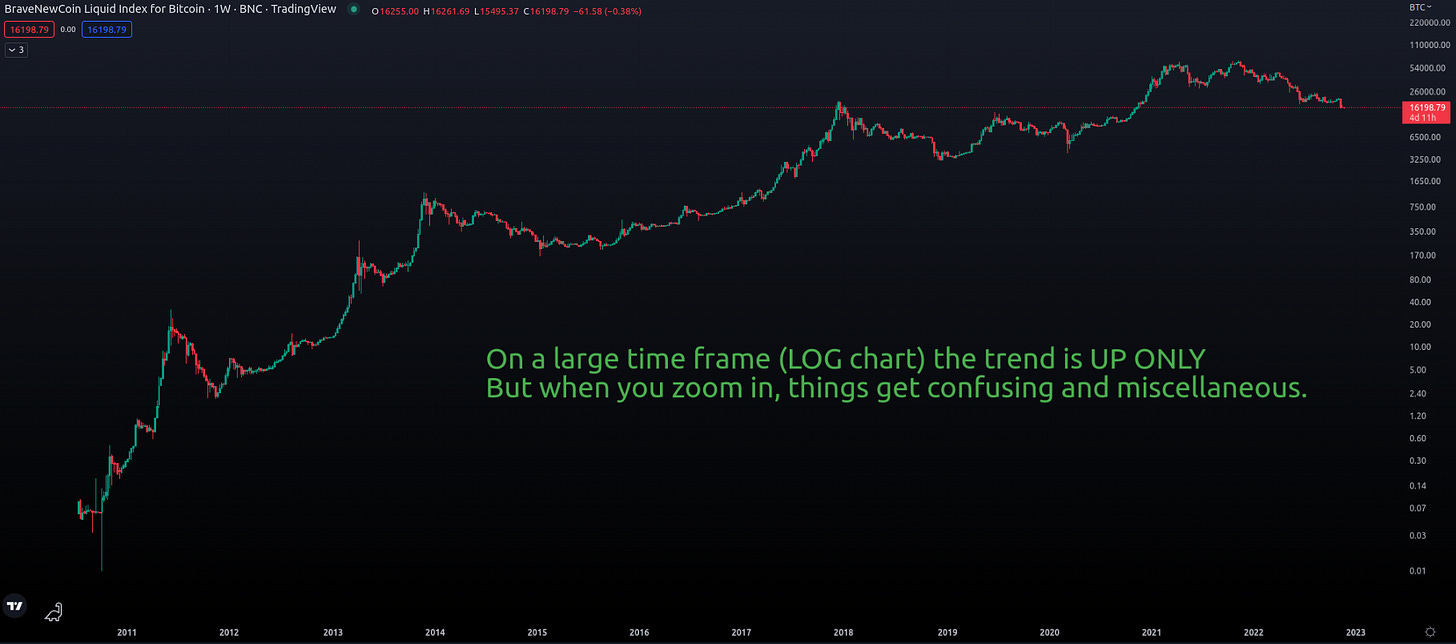
Fun fact, Bitcoin has seen many bear trends, but there is an argument to be made, whether it’s actually ever really been in a proper bear market, if you only look at the chart from a multiyear perspective. On a long enough time line, the price only goes up and to the right. (image below)
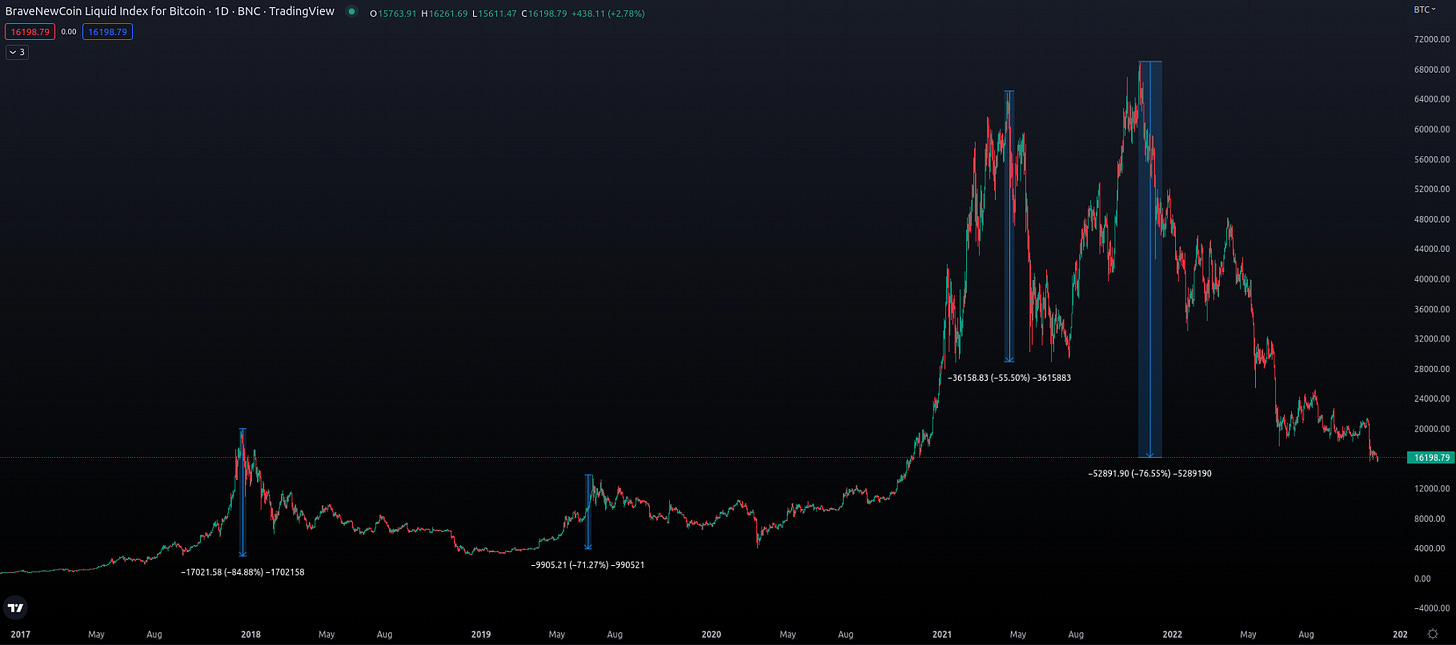
I trade smaller time frames, so from my perspective the bear markets have been very real, very strong and exceedingly painful. At least the first one, the one that got me and ate my lunch. The following bear trends weren’t problematic, because this little idiot had actually learned the most important lesson of them all - always manage risk and never add to losers! Bam, 99% of account blowouts solved in two simple rules.
There is no right or wrong answer here, you have to find out what suits your character and trading style best and adapt to it. Some thrive in day-trading, others in swing trading, some are better off just holding and praying. The first command remains - know thyself!
Alright, but how do we recognize a trend? How do we determine what kind of market we’re in?
There are actually quite a few options, but none of them are absolute or infallible. Most traders like to combine a few “indicators” or market behaviors to confirm their thesis. As in the above examples. My suggestion is that you make a system for yourself, through which you will always observe the market. Your time frame, your indicators, your conclusions etc.
Think about it this way:
In a bull market, the vast majority of market participants are bullish (makes sense, doesn’t it) so the odds are that their side will win most of the trading scenarios. You want to look for long positions.
In a bear market, most participants are bearish and it’s only logical to assume that most market situations will resolve in the downward direction. You want to look for short positions.
In ranging markets, the market participants are relatively equally matched and represented, therefore the price is stuck in a range. No side is strong enough or convicted enough to make any headway. You want to play both sides at the edges.
Generally though, here are a few suggestions on determining the type of market or trend you’re in.
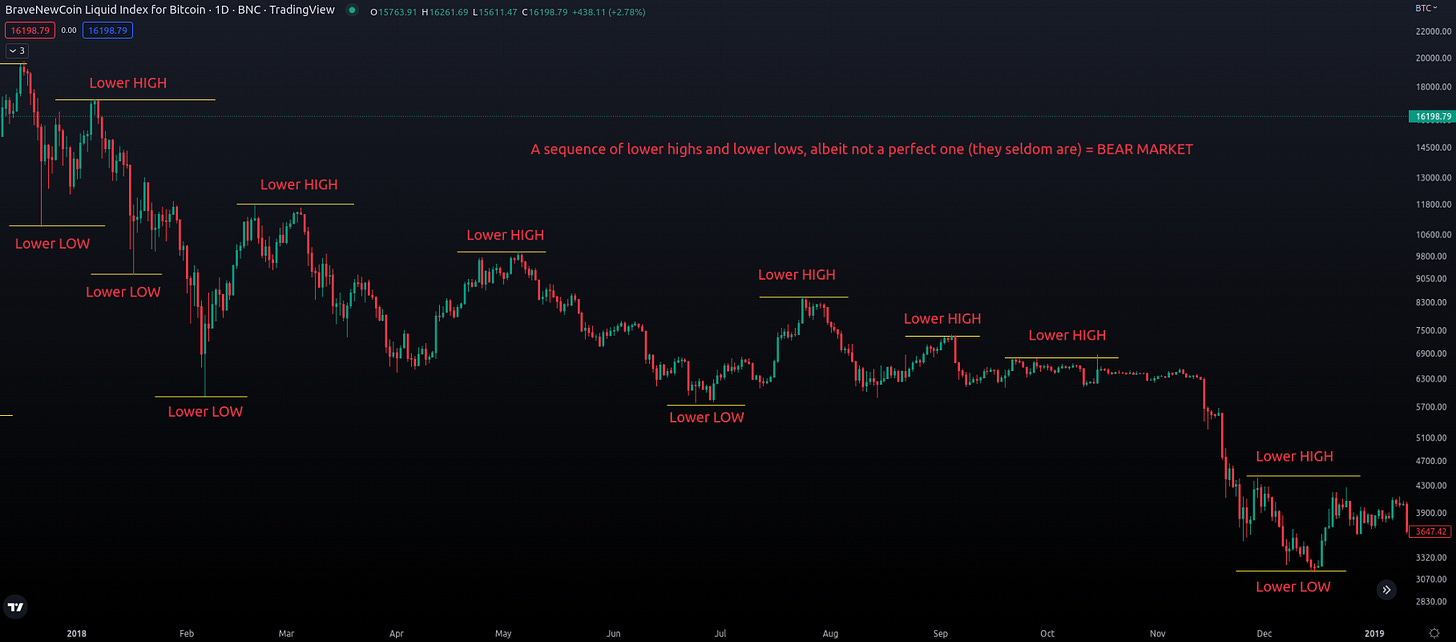
Sequence of higher highs and higher lows, or lower lows and lower highs.
This is probably the best and easiest way to determine a trend. Look at the chart in your selected time frame and simply mark the peaks and valleys on the chart. For a trend to be valid, you’re going to need a few points of confirmation. So for example one higher high and and one higher low doesn’t mean that the trend has necessarily reversed from a previous bear trend. When a few add up though, especially on higher time frames, then the odds of this being a new trend are getting better and better.
Trendlines
You can also draw a trend line connecting the tops and bottoms on the chart and that should then give you a good indication of the trend. Flat, up or down. It’s best to keep things simple and not to overcomplicate things. You do however need at least two touches of a line to call it a trendline. No need to be surgical and over complicate things, as these are only ever estimates and no price will “obey” the line perfectly. The best trends will jump out at you anyway.
EMA (moving averages) price cross
When a price on a daily chart (unit = 1 day) crosses the 50 EMA decisively and stays on the other side, it’s a good indicator of a new trend. MA’s or EMA’s are fairly solid indicators and one of very few I actually check on from time to time on 4H and above time frames. Using them to determine a big market trend however has one fatal flaw, they lag immensely.
When the price is above or below the daily 200 EMA, one could discern from the chart that that is a fairly good indicator of the type of market you’re in. Above = bull market, below = bear market. But in real time, they are fairly useless, unless you’re more of a casual observer and play only really long term games.
The 4h chart EMA’s are more timely, but generate much more false signals, which can confuse a trader, more than add clarity to the situation. Here’s an example of the famous death and golden cross on a 4h Bitcoin chart. When the 50 day EMA crosses the 200 day EMA one of the two is triggered and things do tend to accelerate in the opposite direction at that point. Sometimes. This looks simple in hindsight, but if you look closely you’ll notice it produces a lot of fake signals. Some traders like to add conditions to the cross, such as that the two EMA’s need to grow wide apart for it to have any meaning and so forth. Always go through the chart history for any instrument that you would like to trade and backtest how your systems and triggers worked or didn’t work in the past.
Market sentiment, trader sentiment, general populace sentiment
This is the one that has actually proven to be quite an interesting factor to follow and use as confirmation or indication of what type of market you’re dealing with. The market is after all composed of individuals who choose to speculate on the movements of the price. In fact that is all the market is and is therefore subjected mostly to the opinions and feelings of the majority of individuals and organizations that participate in any given market. But here’s the catch, we can’t know what all of these people are thinking at this moment, so there is no way of properly measuring the sentiment. There are some tools available, but mostly you’ll have to learn to rely on your gut feeling on this one. What are the big brains saying? What is the social media sentiment? What are the normies thinking (non traders or investors)?
First off, there are as many opinions as there are participants, so judging the majority opinion from a few select voices is kind of hard. And secondly, the masses are usually wrong is not just a saying. I’ll give you a hint that has served me well over the years in many markets.
When people, who have nothing to do with the markets professionally, your grandmas, taxi drivers, waiters and hear dressers speculate on an instrument and are bragging about how much money they’re making - run! Sell your shit and run like hell! This is the single best indicator for any and all market tops I’ve ever seen and experienced. It doesn’t matter what it is, real estate, stock market or crypto, when the “uneducated, unconnected masses are making a killing in the market”, that is the clearest sign of an impending top in any market.
Conversely, when nobody seems interested in buying or speculating in a market, and I mean no one, that is usually a good sign to buy everything with projected future value, you can get your hands on.
Volume
Volume is probably one of the most underused indicators in trading. It’s not sexy and it doesn’t really give a clear signal all on its own, but it is an excellent confirmation tool, when used in combination with the aforementioned indications. Look at volume from a perspective of power. If the bears or the bulls start firing large red or green candles across your screen, it might be good to know how many there are and what weapons they are packing. When the bears come in force into the market, the first few down swings are going to be volatile and trading volume will be high (large volume spikes). Same goes for bulls, when the time for a reversal and a strong bull trend is near, the volume spikes up like crazy and usually persists for quite a while. A good rule to remember is to never trust any exceeding market move (breakout or reversal) that isn’t supported by a huge volume spike.
When the markets get overextended, the volume will show it. Last flushes (capitulations) in a bear market are often accompanied by large volume, the market has been cleared and can now reverse its heading. And the same goes for bull market peaks. When the buying is so massive and persistent, there comes a point when there is no one left to buy and the market turns downward.
Reversal price action
There are price action patterns that tend to repeat on big reversals, such as large Pinbar and bullish/bearish engulfing for instance. As a stand alone indication they cannot be counted on, but in combination with support/resistance levels, volume and sentiment, they can be seen as good little hints that something has now changed. Study price action and focus mainly on reversal patterns on larger time frames. This will often prove useful when having to make trading decisions.
Fundamentals or general world situation
I am mentioning this last, for I am not really a fan of fundamentals in trading, apart from the obvious differences between good investments and bad ones (scams and so on). Why not? Well, maybe it’s because I don’t believe I really have the right access to early information that would give me an edge in the market or maybe it’s because I was simply focused on technicals for so long, that I find adding fundamental data just unreliable noise. The fundamental shifts and important data points will be visible in the charts anyway, as the ones with the proper information will be acting on it (the insiders, professionals, whales). The fundamental information that is available to me, a lone trader sitting in my bedroom (retail personified), is readily available to all, meaning it’s useless as a trading tool.
In crypto this “fundamentals vs. technicals” is an especially pointless debate. Fundamentally only Bitcoin matters, more or less, and the market has proven this thesis over and over again. A lot has been promised, a lot has been said about the fundamental value of altcoins, technical specifications, properties, ideas and so on, but none of them have ever proven to be more important than simple market sentiment, cycles and charts. Even the most promising new altcoins follow the same path as the rest of them and the vast majority are headed to zero over time. This of course is only my opinion and experience, so feel free to disagree with me on this one.
If you want fundamental value, stick to Bitcoin. If the market survives in the long term, the odds are overwhelming that Bitcoin will be the big winner. Yes, there will always be new projects, altcoins and experiments to make money on, but for the time being, fundamentals have nothing to do with it. Their perceived value is composed solely from the screaming of influencers, aggressive marketing, market cycles and hopium.
We cannot however ignore fundamentals from the big boys these days. The FED for instance. Nothing we were taught about economics is still valid and true. To hell with supply and demand. There is no real market anymore, only politics and the central banks doing their bidding. So the price of your favorite anything really is not dependent on the solid fundamentals it may or may not possess, but on the whims of a few old men sitting behind a table, effectively ruling the world without the use of armies, simply by “manipulating” the money supply. Lately the markets have been so brainwashed, that their mere debating wreaks havoc on the markets on a monthly basis.
All in all, the greater world situation matters, but is sometimes hard to predict. With a World War 3 looming over our heads, confused and idiotic leadership in every country, people who shouldn’t be trusted to watch over a school dance, playing their stupid games of ideology and populism with the lives of their citizens, it’s difficult to predict anything. When you see the world effectively stop for two freaking years, and the economy is busting with profits, the markets reaching record highs, employment almost full and money just being relentlessly printed in unprecedented amounts, like it just doesn’t matter, then making any sort of educated, logical guess as to what the future will bring seem trivial. There is no more logic in this world. There is no more science apparently either, nor sanity at the top.
“With every action there's an equal opposite reaction.” ― Albert Einstein
So grab onto your pants, forget everything you know to be true (the powers that be will help you there) and pray to whomever you pray to, that we will not be spending the next few decades paying a hefty price for this monumental stupidity (or malice). Fundamentally, logically we probably should. But then again, maybe this is just a simulation we’re living in and somebody can just manipulate the source code so that our actions, no matter how terrible, will this time have no actual consequences, in contrast with the laws of Physics, Nature, essentially the Universe.
Until then, check your charts and do your very best to determine the appropriate time frame conditions and adapt to the given circumstances, whatever they may be. Good luck to us all!
Disclaimer: nothing here is financial advice, just a fellow trader meditating on his trading journey, sharing the lessons he learned and debating some personal opinions that are only that, opinions and nothing more.
This newsletter is supported by you, dear readers, no one else.
I invest a lot of time and effort into writing this content and I do not get paid for my work. If you enjoy reading this newsletter and would like to support my work you may do so in one of the following ways:
- Share this content.
- Become a free or paid subscriber of the Newsletter.
- Become my Patron (tip jar)
- Buy me a cup of coffee with Bitcoin.
Bitcoin wallet: bc1qc60qsgtwzhgv3nnxvx6jlsuxh2zh55x3s4fv7w


